
Short answer: Website conversion rate is the share of visits that end in a lead or sale: conversions divided by visits. There's no universal good number, so set your own baseline by page, source and device, make sure calls and forms are tracked, then fix one leak at a time and compare against that baseline.
What website conversion rate means for a service business
Website conversion rate is the share of visits that end in an action you care about: a call, a form, a booking or an order. For a service business, the conversions that matter are the ones that start a conversation with a real customer.
That definition matters more than any benchmark. A rate that counts newsletter sign-ups or page scrolls can look healthy while the phone stays quiet. So before you ask whether your website conversion rate is good, decide what counts as a conversion, confirm it's tracked, and compare the site against its own history rather than someone else's average.
Most owners asking this question want the same thing: more calls from the traffic they already have. That's a website problem as much as a marketing one, and it's the work our website and branding service is built around: pages that make the next step obvious on a phone, with every lead tracked.
The conversion rate formula, and the versions GA4 shows you
The conversion rate formula is conversions divided by visits, shown as a percentage. Google's conversion rate definition for Google Ads gives a simple example: 50 conversions from 1,000 interactions is a 5% conversion rate.
Google Analytics 4 uses its own names. Google now calls the actions that matter to your business key events, and reserves the word conversion for actions used to measure and optimize ad campaigns. Its metrics reference defines two rates you'll see in reports:
| Metric | How it's calculated | Best for |
|---|---|---|
| Session key event rate | Sessions in which a key event happened, divided by total sessions | Comparing pages and traffic sources |
| User key event rate | Users who performed a key event, divided by total users | Seeing how many people, not visits, became leads |
| Google Ads conversion rate | Conversions divided by ad interactions in the same period | Judging campaigns and keywords |
All three are only as good as what you mark as a key event. If you haven't set up calls, forms and bookings yet, start with our guide to tracking calls and form fills in GA4. A tap on a phone number is a click, not a completed call, so the real call count needs call tracking.
Sessions or users? Use the session rate to compare pages and sources, and the user rate to count people. A customer who visits three times before calling counts as three sessions and one user, so a business with a long decision, like a roof or a remodel, will usually show a lower session rate than user rate.
Where to look for it in GA4
For the most detail, build an Exploration report with session key event rate as the metric, broken down by landing page, session source and device category, over a full month. Explorations only reach back as far as your data retention setting, which a standard property can set to 2 or 14 months, and Google says that setting doesn't affect standard reports, even when you add comparisons. So compare this month with the same month last year in a standard report, using its comparison date range, and set retention to 14 months in Admin so your Explorations keep more history. Keep the key events limited to real leads, so the rate isn't padded by scrolls or video plays.
What is a good conversion rate for a website? Your own last quarter
There's no single good number, and we won't invent one. Published averages mix online stores with service businesses, small impulse purchases with large projects, and newsletter sign-ups with booked appointments. Your rate also swings with your traffic mix: people who already know your name convert very differently from strangers clicking an ad.
Definitions differ too. One site counts every phone tap and form view, another counts only completed forms and answered calls. Two businesses with identical results can report very different rates, which is why a number borrowed from someone else's report can't tell you whether your site is working.
The benchmark that tells you something is your own. Build a baseline from these comparisons:
- This month against the same month last year, so seasonal swings don't fool you.
- Each page against your site average. A service page with plenty of visits and few leads is your biggest opportunity.
- Each traffic source against the others: search, your Google Business Profile, ads, social and email.
- Phone against desktop. If phone visitors convert far less, the problem is usually the phone layout.
- The raw number of leads beside the rate. If traffic falls, the rate can rise while leads drop, and the rate alone would hide it.
Report these monthly, next to booked jobs and revenue. Our guide to the five numbers every marketing report should show covers the numbers that belong beside it: leads by source, cost per lead and how many leads booked.
Count, Check, Compare, Change: raise the rate without guessing
Most conversion advice jumps straight to button colors. We use a four-step loop we call Count, Check, Compare, Change. It's our editorial framework, not a published standard, and it puts measurement before any redesign.
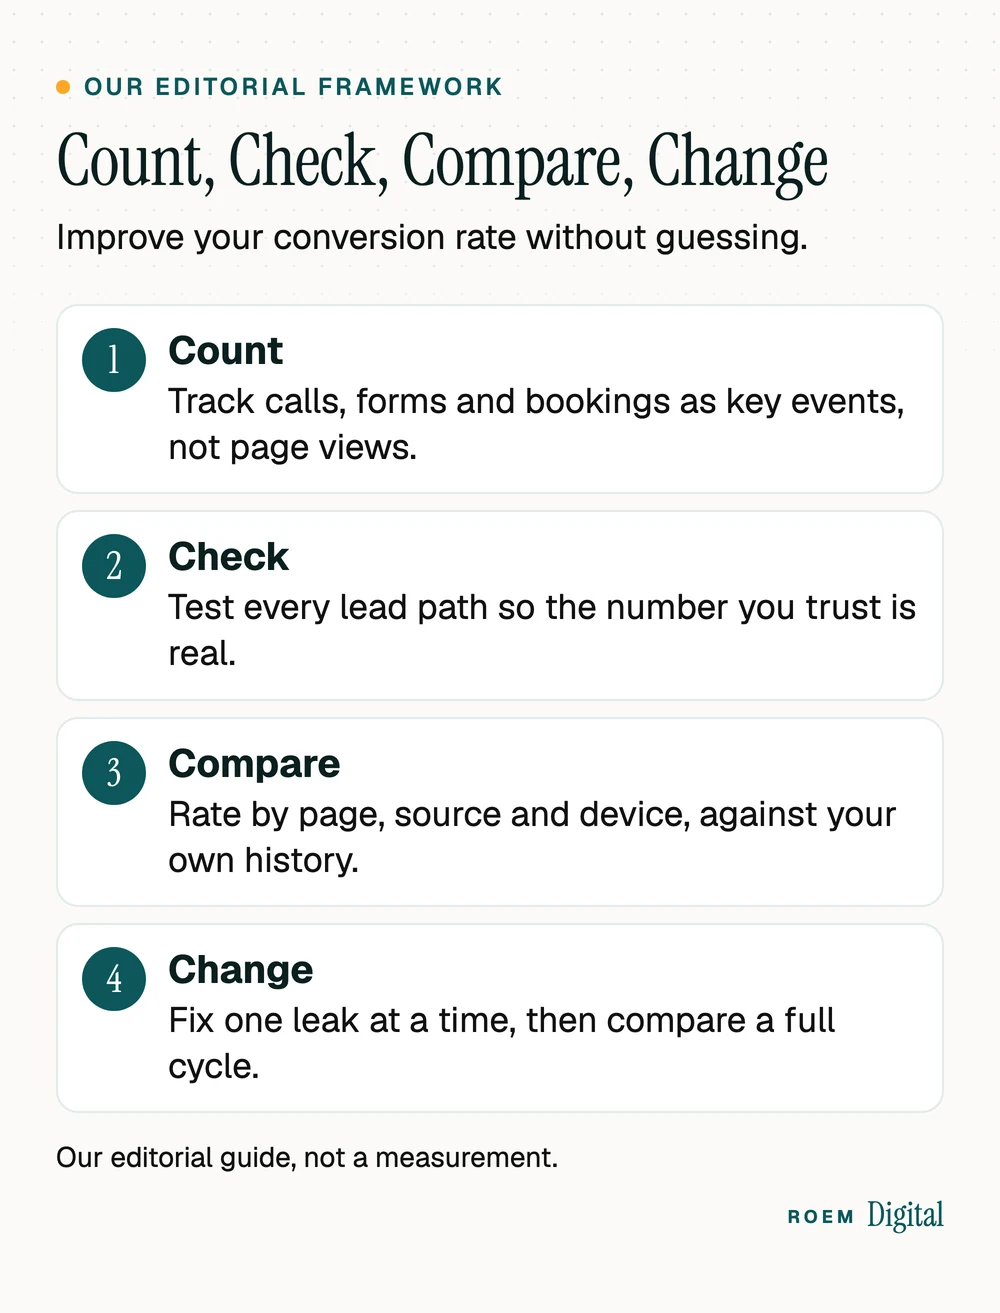
- Count the conversions that start a conversation: calls, forms, bookings and orders, each marked as a key event.
- Check that every path works and gets recorded. Submit each form, tap each call button, and confirm the event shows up in GA4. A broken form makes a good page look like a bad one. Our website launch checklist has the full test routine.
- Compare pages, sources and devices against your baseline to find the leak: the place where interested visitors stop.
- Change one thing on that page, then compare a full business cycle against the baseline before you change the next.
Changing five things at once can raise the rate, but you won't know which change did it, or which one quietly hurt.
How to improve website conversion rate: fixes to test first
Once you know which page leaks, these are the changes most worth testing on a service business site, roughly in order of effort:
- Make one main action obvious on a phone. A visitor should see how to call, book or request a quote in the first screen, without opening a menu.
- Turn the phone number into a tap-to-call button, and make sure someone answers it during the hours you advertise.
- Cut form fields. Nielsen Norman Group's guide to website form usability puts it plainly: every time you cut a field or question from a form, you increase its conversion rate. Ask only for what you need to call back.
- Put proof beside the button: real photos of your work, reviews, licenses and the towns you serve.
- Show your hours and service area near the button, so nobody has to wonder whether you cover their town or are open right now.
- Offer one lighter option for people not ready to call, such as a text message or a short quote form, styled so it doesn't compete with the main button.
- Answer the price question, even with a starting point or what drives the cost. Silence on price can send people back to the search results.
- Match the page to the ad. Paid visitors should land on a page about the exact service they searched for. Our guide to landing pages for Google Ads shows how.
- Fix speed on phones. The Core Web Vitals guide on web.dev sets good targets at a Largest Contentful Paint within 2.5 seconds, an Interaction to Next Paint of 200 milliseconds or less and a Cumulative Layout Shift of 0.1 or less.

Forms are worth extra attention. NN/g also reports a 2014 study by Seckler and colleagues in which 78% of submissions were error-free on the first try for forms that followed usability guidelines, against 42% for forms that didn't. Clear labels, a single column and helpful error messages are cheap fixes.
The last step happens off the website. A lead that waits hours for a reply may book someone else, so pair these fixes with a fast follow-up habit. Our guide to speed to lead covers that side.
Start with the page that gets the most visits
A small improvement on a busy page produces more leads than a big improvement on a page nobody visits. Sort your landing pages by sessions, pick the busiest one with a below-average rate, and start there.
When a higher conversion rate isn't the goal
Conversion rate is a ratio, so it can move for the wrong reasons. Watch for these before you celebrate or panic:
- Less traffic, same leads. Turning off a broad ad campaign can lift the rate while total leads stay flat.
- Spam form fills. Bots can inflate form conversions. Compare GA4's count with the real inquiries in your inbox.
- Easy conversions that don't book. A free download converts well and may never become a customer.
- Tracking changes. A new tag, a site update or a changed thank-you page can move the number without a single customer behaving differently.
The number that pays the bills is booked jobs, and for paid traffic, cost per booked job. If you run ads, our paid media and lead generation service tracks calls, forms and bookings before any ad spend starts, so campaigns are judged by the leads they produce, not by the rate alone.
Track what happens after the lead
A simple monthly sheet does it. List every call and form, where it came from, and whether it booked. Then you can see your lead-to-booking rate by source, which tells you whether a page that converts well is bringing in the right people. Ask new customers how they found you, and write the answer down. It catches the referrals and repeat customers analytics will never see.
How we approach conversion on the sites we build
We're a small senior team based in Davenport, Florida. We hand-build websites rather than adapting templates, calls, forms and bookings are tracked before any ad spend starts, and our clients own their analytics, so the baseline is theirs to keep. For an example of tracked, measured work over time, the Haven Noire case study shows 2.7x clients and 7x monthly revenue in 13 months for a boutique spa brand in the Kissimmee area.
Read more about our website and branding work, or if your site is about to change, our website launch checklist shows how to protect your tracking through the switch.
Frequently asked questions
What is a good conversion rate for a website?
There's no universal good number. Rates depend on what you count as a conversion, your traffic sources, your prices and your industry. The useful benchmark is your own: compare each page, source and device against your site's history, and track the raw number of leads beside the rate so a traffic drop doesn't fool you.
How do you calculate website conversion rate?
Divide conversions by visits and multiply by 100. Google's own example: 50 conversions from 1,000 interactions is a 5% conversion rate. In Google Analytics 4, the session key event rate is the number of sessions with a key event divided by total sessions, which is the closest match for a website.
Should phone calls count as website conversions?
Yes. For most service businesses, calls are the most important conversion. GA4 can record taps on your phone number as a key event, but a tap isn't a completed call. To count real calls by source, use a call tracking service, and test it before you trust the numbers.
Why did my website conversion rate suddenly drop?
Check tracking first: a broken form, a removed tag or a changed thank-you page can drop the rate overnight. Then look for a change in traffic mix, such as a new ad campaign bringing colder visitors, a page edit, a slower page or a normal seasonal dip. Compare with the same month last year.
How long should I test a change before judging it?
Long enough to cover a full business cycle and enough leads to see a real difference, not one good week. For many local service businesses that means at least several weeks. Change one thing at a time, and compare against the same period before the change and the same weeks last year.
Is session key event rate the same as conversion rate?
Close. Google now calls the website actions that matter to your business key events, and uses conversion for actions used to measure and optimize ad campaigns. Session key event rate, sessions with a key event divided by total sessions, is GA4's version of a website conversion rate.